User Guide
Document Conventions
This User Guide is written for end-users of vcs, rather than developers. If you have suggestions or questions about this documentation, feel free to contact us on UV-CDAT mailing list.
vcs specific entities will be formatted like this.
Installation
While there are many ways a user can install vcs, installation using conda is preferred for the end user. To install just vcs or uvcdat, make sure that anaconda or miniconda is installed and in path of your shell. Information on how to install conda can be found here. Very conda is available on the shell using the following command
conda --help
To enable conda installation in a tight ssl certificate/security environment try
conda config --set ssl_verify False
Install uvcdat which will install vcs as well using the following command
conda install cdat -c conda-forge -c cdat
To install only vcs, use the following command
conda install vcs -c conda-forge -c cdat
On headless servers or if you run into DISPLAY/OpenGL issues at runtime you might want to enable the mesalib version (this can be done after the fact):
conda install mesalib -c conda-forge -c cdat
Concepts
The VCS module can accept data from the CDMS module or can use the numpy array. For use on how to use either of the mentioned modules, see their respective documentation. For examples on the direct use of these modules, see the VCS API Examples chapter and the examples located throughout this texts.
VCS Model
VCS Allows scientists to produce highly customized plots. Everything can be precisely and logically controlled, without any guessing game
Essentially a vcs plot can be broken down into three parts
WHAT is plotted (e.g data and labels) HOW it is rendered (isolines, boxfill, isofill, vectors, etc…) WHERE (location on the page each elements is to be plotted)
What
This is the scientific piece of information that the user is trying to represent for others (or self) to understand. It can be as raw as a simple numpy object. But it is recommended to use [CDMS](https://github.com/uv-cdat/cdms)’s transient variables. CDNS transient variables contain metadata such as name, units, geospatial information, that can be used by VCS to represent data better.
The [tutorials] section has many documents for CDMS. The CDMS documentation can be found [here](http://readthedocs.org/projects/cdms/)
How
This describe the data representation, at the highest level it is a “graphics method” i.e boxfill, isofill, vectors, streamlines, line plot, etc… But it also contains information to further control these plot types, e.g which colors to use, which levels, lines thickness, etc…
Graphic methods also describe how axes and labels show be represented (e.g which axes values to show and which text to use for it, the user might want to show the -20. longitude represented as 20S or the date 2020-01-15 shown as Jan 2020
Currently VCS supports the following graphic methods
Where
This is the most complicated part of VCS but also one of the most powerful. This controls precisely the location of every component on the plot, these control objects are called templates. Templates also contain one exception to the WHAT/HOW./WHERE rule as they control texts information, albeit via [primary](#primary) objects.
Bringing it all together
VCS Primary Objects (or Primary Elements)
A description of each primary object is warranted before showing their use and usefulness in VCS. See descriptions below.
Graphics Method Objects
A graphics method simply defines how data is to be displayed on the screen. Currently, there are eleven different graphics methods with more on the way. Each graphics method has its own unique set of attributes (or members) and functions. They also have a set of core attributes that are common in all graphics methods. The descriptions of the current set of graphics methods are as follows:
boxfill- The boxfill graphics method draws color grid cells to represent the data on the VCS - Canvas. Its class symbol or alias is “Gfb”.continents- The continents graphics method draws a predefined, generic set of continental -outlines in a longitude by latitude space. To draw continental outlines, no external data set is required. Its class symbol or alias is “Gcon”.isofill- The isofill graphics method fills the area between selected isolevels (levels of constant value) of a two-dimensional array with a user-specified color. Its class symbol or alias is “Gfi”.isolineobject- The isoline graphics method draws lines of constant value at specified levels in order to graphically represent a two-dimensional array. It also labels the values of these isolines on the VCS Canvas. Its class symbol or alias is “Gi”.outfill- The outfill graphics method fills a set of integer values in any data array. Its primary purpose is to display continents by filling their area as defined by a surface type array that indicates land, ocean, and sea-ice points. Its class symbol or alias is “Gfo”.outline- The Outline graphics method outlines a set of integer values in any data array. Its primary purpose is to display continental outlines as defined by a surface type array that indicates land, ocean, and sea-ice points. Its class symbol or alias is “Go”.scatter- The scatter graphics method displays a scatter plot of two 4-dimensional data arrays, e.g. A(x,y,z,t) and B(x,y,z,t). Its class symbol or alias is “GSp”.vector- The Vector graphics method displays a vector plot of a 2D vector field. Vectors are located at the coordinate locations and point in the direction of the data vector field. Vector magnitudes are the product of data vector field lengths and a scaling factor. Its class symbol or alias is “Gv”.xvsy- The XvsY graphics method displays a line plot from two 1D data arrays, that is X(t) and Y(t), where ‘t’ represents the 1D coordinate values. Its class symbol or alias is “GXY”.xyvsy- The Xyvsy graphics method displays a line plot from a 1D data array, i.e. a plot of X(y) where ‘y’ represents the 1D coordinate values. Its class symbol or alias is “GXy”.Yxvsx- The Yxvsx graphics method displays a line plot from a 1D data array, i.e. a plot of Y(x) where ‘x’ represents the 1D coordinate values. Its class symbol or alias is “GYx”.3dscalar- The 3dscalar graphics method displays an interactive 3D plot of a 4-dimensional (x,y,z,t) data array. Its class symbol or alias is “3d_scalar”.3dvector- The 3dvector graphics method displays an interactive 3D plot of a 4-dimensional (x,y,z,t) vector field. Its class symbol or alias is “3d_vector”.
Picture Template Object
A picture template determines the location of each picture segment, the space to be allocated to it, and related properties relevant to its display. The description of the picture template is as follows:
template- Picture Template attributes describe where and how segments of a picture will be displayed. The segments are graphical representations of: textual identification of the data formatted values of single-valued dimensions and mean, maximum, and minimum data values axes, tick marks, labels, boxes, lines, and a legend that is graphics-method specific the data. Picture templates describe where to display all segments including the data. Its class symbol or alias is “P”.
Data Object
Array data attribute sets and their associated dimensions are to be modified outside of VCS. See the CDMS2 module documentation for data extraction, creation and manipulation.
VCS Secondary Objects (or Secondary Elements)
A description of each secondary object is warranted before showing their use and usefulness in VCS. It is these secondary objects that defines the detailed specification of the primary objects’ attributes. Currently, there are five secondary objects with more to follow.
Colormap Object
The colormap object is used to specify, create, and modify colormaps. There are 256 colors and color indices, but only the first 240 color indices can be modified (indices 240 through 255 are reserved for VCS internal use). The description of the colormap object is as follows:
colormap- A colormap contains 240 user-definable colors that are used for graphical displays. The color mixtures are defined in terms of percentages of red, green, and blue colors (0 to 100% for each). The resulting color depends on the specified mixtures of red, green, and blue. Its class symbol or alias is “Cp”.
Note
VCS colormaps are objects, but they are not referenced like other secondary objects.
Fillarea Object
The fillarea objects allows the user to edit fillarea attributes, including fillarea interior style, style index, and color index. The description of the fillarea object is as follows:
fillarea- The fill area attributes are used to display regions defined by closed polygons, which can be filled with a uniform color, a pattern, or a hatch style. Attributes specify the style, color, position, and dimensions of the fill area. Its class symbol or alias is “Tf”.
Line Object
The line object allows the editing of line type, width, and color index. The description of the line object is as follows:
line- The line attributes specify the type, width, and color of the line to be drawn for a graphical display. Its class symbol or alias is “Tl”.
Marker Object
The marker object allows the editing of the marker type, width, and color index. The description of the marker object is as follows:
marker- The marker attribute specifies graphical symbols, symbol sizes, and colors used in appropriate graphics methods. Its class symbol or alias is “Tm”.
Text Objects
Graphical displays often contain textual inscriptions, which provide further information. The text-table object attributes allow the generation of character strings on the VCS Canvas by defining the character font, precision, expansion, spacing, and color. The text-orientation object attributes allow the appearance of text character strings to be changed by defining the character height, up-angle, path, and horizontal and vertical alignment. The text-combined object is a combination of both text-table and text-orientation objects. The description of the text objects are as follows:
textcombined- The text-combined attributes combine the text-table attributes and a text-orientation attributes together. From combining the two classes, the user is able to set attributes for both classes at once (i.e., define the font, spacing, expansion, color index, height, angle, path, vertical alignment, and horizontal alignment). Its class symbol or alias is “Tc”.textorientation- The text-orientation attributes set names that define the height, angel, path, horizontal alignment and vertical alignment. Its class symbol or alias is “To”.texttable- The text-table attributes set names that define the font, spacing, expansion, and color index. Its class symbol or alias is “Tt”.
Getting Started with VCS
Import VCS
In Python, before one can start using a module they must first load it. To load the VCS module, like all other Python modules, either type:
from vcs import
or
import vcs
If you use import vcs, then you must prepend “vcs” to certain calls
(e.g., vcs.help()). If you use from vcs import *, then you must
be aware of possible name clashes. That is, if two packages are imported
using the form from name import * and both have a “help” function,
then Python doesn’t know which help function to call. For such
cases, and indeed as an unspoken rule, it is best to use “import name”
to avoid name clashing between packages.
Create Canvas Object
To construct a VCS Canvas object type the following:
a = vcs.init()
There can only be at most 8 VCS Canvas objects initialized at any given time.
Plotting in VCS
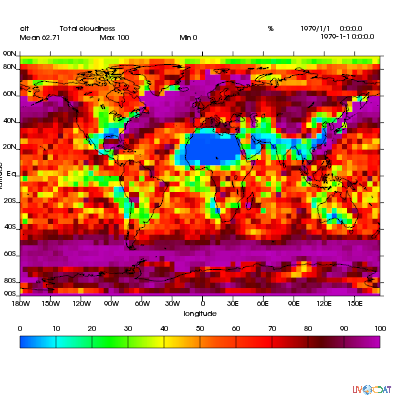
There are several different ways to display data on the VCS Canvas. The most basic way is to use the plot() function. The simple plot() function command: plot(array1,[array2], [template object], [graphics_method object]). The examples below are showing how to plot a simple array using default values for everything else.
# Import vcs and io (cdms) modules
import vcs
import cdms2

# Open sample NetCDF data file. Depending on the location of clt.nc
# a relative or absolute path might be needed.
data = cdms2.open('clt.nc')

# Initialize vcs with specific width and height
# and then plot the variable
canvas = vcs.init(geometry=(400, 400))
clt = data['clt']
canvas.plot(clt)

# Close the canvas context
canvas.close()
The script should produce a plot as shown below:
As mentioned earlier, vcs can use numpy array directly. The example below shows how to plot numpy array data.
# Import necessary modules
import vcs
import cdms2
import numpy

# Manually create data
data = numpy.sin(numpy.arrange(100))

# Reshape to make it useful for vcs
data = numpy.reshape(data, (10, 10))

# Initialize vcs and then plot the data
canvas = vcs.init()
canvas.plot(data)

# Close the canvas context
canvas.close()
It should be noted that plot can take multiple arguments. For example, plot can take bg=1 option to draw visualization in the background. Below is the plotting climate data example with few new options to plot method.
# Import vcs and io (cdms) modules
import vcs
import cdms2

# Open sample NetCDF data file
data = cdms2.open('clt.nc')

# Initialize vcs and then plot the variable
canvas = vcs.init()

# Create isofill graphics method
iso = canvas.createisofill()

# Create default template
template = canvas.createtemplate()

# Scale down visualization space
template.scale(0.8)

clt = data['clt']

# Plot isofill with continents outline and custom template
canvas.plot(template, iso, clt, continents=1)

# Close the canvas context
canvas.close()
Note
When using the plot() function, keep in mind that all keyword arguments must be last. The order of the arguments is not restrictive, just as long as they are before any keyword argument.
Other Plotting functions in VCS
There are other ways to plot data in VCS. These additional plotting routines utilizes the same parameter format as the plot() function. What makes these plotting functions unique are their direct association with the graphics methods. That is, each graphics method has its own plot function. For example, if the user wishes to plot data using the isofill graphics method, then the function isofill() can be used instead of the plot() function. If the isofill object is not specified then the default isofill graphics method will be used. The user can also pass down the name of the graphics method to be used. In some ways, the graphics method plot functions can be thought of as short cuts to plotting data.
Note, if a different graphics method object is specified and passed down to one of these alternate plot functions, then the alternate plot function will behave as the plot() function and plot the data in the specified graphics method format.
See table below for additional plot functions.
Plot Function |
Description |
|---|---|
|
plot data using the boxfill graphics method |
|
plot to the screen continental graphics method |
|
plot data using the isofill graphics method |
|
plot data using the isoline graphics method |
|
plot data using the outfill graphics method |
|
plot data using the outline graphics method |
|
plot data using the scatter graphics method |
|
plot data using the vector graphics method |
|
plot data using the xvsy graphics method |
|
plot data using the xyvsy graphics method |
|
plot data using the yxvsy graphics method |
|
plot data using the 3d_scalar graphics method |
|
plot data using the 3d_vector graphics method |
Creating VCS Objects
The create functions enables the user to create VCS objects which can be modified directly to produce the desired results. Since the VCS “default” objects do allow modifications, it is best to either create a new VCS object or get an existing one. When a VCS object is created, it is stored in an internal table for later use and/or recall.
Create the following VCS objects:
Create Function |
Description |
|---|---|
|
creates a new boxfill graphics method object |
|
creates a new continents graphics method object |
|
creates a new fillarea secondary object |
|
creates a new isofill graphics method object |
|
creates a new isoline graphics method object |
|
creates a new line secondary object |
|
creates a new marker secondary object |
|
creates a new outfill graphics method object |
|
creates a new outline graphics method object |
|
creates a new scatter graphics method object |
|
creates a new text-combined secondary object |
|
creates a new text-orientation secondary object |
|
creates a new text-table secondary object |
|
creates a new vector graphics method object |
|
creates a new xvsy graphics method object |
|
creates a new xyvsy graphics method object |
|
creates a new xyvsy graphics method object |
|
creates a new 3d_scalar graphics method object |
|
creates a new 3d_vector graphics method object |
Get Existing VCS Objects
The get functions are used to obtain VCS objects that exist in the object memory tables. The get function directly manipulates the object’s attributes in memory. If the object is used to display data on a plot and is manipulated by the user, then the plot will be automatically updated.
Get the following VCS objects:
Get Function |
Description |
|---|---|
|
get specified boxfill graphics method and create boxfill object |
|
get specified continents graphics method and create continents object |
|
get specified fillarea secondary object and create fillarea object |
|
get specified isofill graphics method and create fillarea object |
|
get specified isoline graphics method and create isoline object |
|
get specified line secondary object and create line object |
|
get specified marker secondary object and create marker object |
|
get specified outfill graphics method and create outfill object |
|
get specifed outline graphics method and create outline object |
|
get specified scatter graphics method and create scatter object |
|
get specified text-combined secondary object and create text-combined object |
|
get specified text-orientation secondary object and create text-orientation object |
|
get specified text-table secondary object and create text-table object |
|
get specified vector graphics method and create vector object |
|
get specified xvsy graphics method and create xvsy object |
|
get specified xyvsy graphics method and create xyvsy object |
|
get specified yxvsx graphics method and create yxvsx |
|
get specified 3d_scalar graphics method and create 3d_scalar |
|
get specified 3d_vector graphics method and create 3d_vector |
Removing VCS Objects
Unwanted VCS objects can be removed from internal memory with the use of the remove function. The remove function will identify the VCS object type and remove it from the appropriate object table.
Remove VCS objects:
Remove |
Description |
|---|---|
|
allows the user to remove objects from the appropriate object list |
Show VCS Object List
The show function is handy to list VCS objects tables.
The show function is used to list the VCS objects in memory:
Show Function |
Description |
|---|---|
|
list VCS primary and secondary class objects in memory |