Basic VCS Tutorial
[37]:
import vcs
import cdms2
[38]:
# MAke sure sample data is here
vcs.download_sample_data_files()
[39]:
f=cdms2.open(vcs.sample_data+"/clt.nc")
[40]:
# LOAS SAMPLE DATA
s=f("clt")
[41]:
# Create vcs canvas (basically X window to draw in)
x=vcs.init()
[42]:
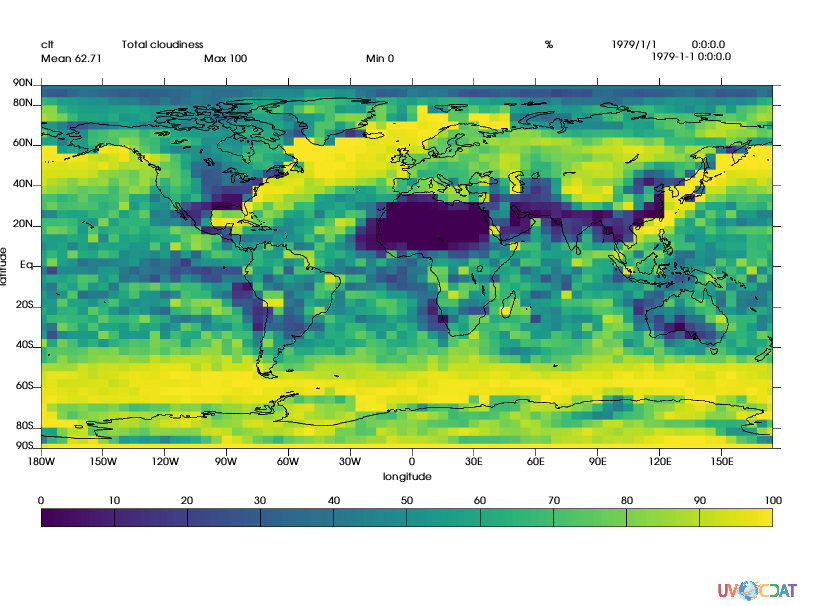
# plot data as is
[43]:
#because we are in jupyter using bg=True to plot thing in background (no flashing on your screen)
bg=True
x.plot(s,bg=bg)
[43]:
[44]:
# Now let's explore some graphics methods available
print vcs.listelements()
['1d', '3d_dual_scalar', '3d_scalar', '3d_vector', 'boxfill', 'colormap', 'display', 'fillarea', 'font', 'fontNumber', 'isofill', 'isoline', 'line', 'list', 'marker', 'meshfill', 'projection', 'scatter', 'taylordiagram', 'template', 'textcombined', 'textorientation', 'texttable', 'vector', 'xvsy', 'xyvsy', 'yxvsx']
[45]:
# Let's create a isofill
gm = vcs.createisofill()
[46]:
# Let's see what we can set/do with this
gm.list()
 ----------Isofill (Gfi) member (attribute) listings ----------
graphics method = Gfi
name = __isofill_47070857589361
projection = linear
xticlabels1 = *
xticlabels2 = *
xmtics1 =
xmtics2 =
yticlabels1 = *
yticlabels2 = *
ymtics1 =
ymtics2 =
datawc_x1 = 1e+20
datawc_y1 =  1e+20
datawc_x2 =  1e+20
datawc_y2 =  1e+20
datawc_timeunits =  days since 2000
datawc_calendar =  135441
xaxisconvert =  linear
yaxisconvert =  linear
missing =  (0.0, 0.0, 0.0, 100.0)
ext_1 =  False
ext_2 =  False
fillareastyle =  solid
fillareaindices =  [1, 1, 1, 1, 1, 1, 1, 1, 1, 1, 1, 1, 1, 1, 1, 1, 1, 1, 1, 1]
fillareacolors =  [1]
fillareaopacity =  [None, None, None, None, None, None, None, None, None, None, None, None, None, None, None, None, None, None, None, None]
levels =  ([1.0000000200408773e+20, 1.0000000200408773e+20],)
legend =  None
The Graphic Method Controls How Things are Drawn datawc stands for dataworldcoordinates x/yticlabels are the labels to useon x/y axes (python dictionaries {location_value:“string”} x/ymtics are the ticks w/o strings missing is color to use for misssing values (index in colormap, (r,g,b,o) or “string”) fillarea are the contour properties
[47]:
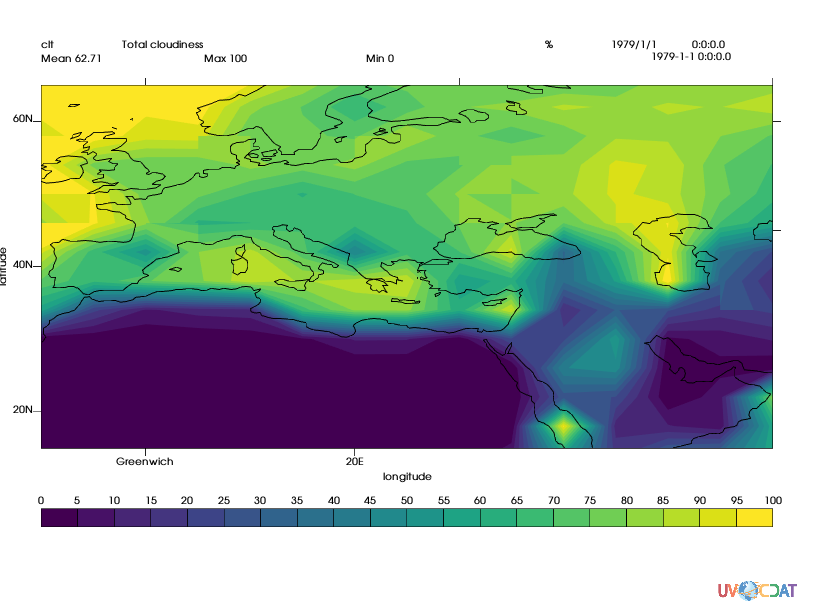
gm.datawc_x1 = -10
gm.datawc_x2 = 60
gm.datawc_y1= 15
gm.datawc_y2 = 65

gm.xticlabels1 = {0:"Greenwich", 20:"20E"}
gm.yticlabels2 = {0:"Equator",60:"Arctic Circle", 45:"45N"}

levels = range(0,101,5) # iso contours to use
colors = vcs.getcolors(levels) # automatically picks colors spread accross your color map
gm.levels = levels
gm.fillareacolors = colors

x.clear()
x.plot(s,gm,bg=bg)
[47]:
[48]:
# now to control the LOCATION of elements we use a *template*
t = vcs.createtemplate()
[49]:
# t.list() would list all properties we can set
t.list()
----------Template (P) member (attribute) listings ----------
method = P
name = __template_210241759330535
orientation = 0
member =  file
     priority = 1
     x = 0.0500000007451
     y = 0.0130000002682
     texttable = default
     textorientation = default
member =  function
     priority = 1
     x = 0.0500000007451
     y = 0.0130000002682
     texttable = default
     textorientation = default
member =  logicalmask
     priority = 1
     x = 0.0500000007451
     y = 0.0329999998212
     texttable = default
     textorientation = default
member =  transformation
     priority = 1
     x = 0.0500000007451
     y = 0.0529999993742
     texttable = default
     textorientation = default
member =  source
     priority = 1
     x = 0.0500000007451
     y = 0.941999971867
     texttable = default
     textorientation = default
member =  dataname
     priority = 1
     x = 0.0500000007451
     y = 0.922999978065
     texttable = default
     textorientation = default
member =  title
     priority = 1
     x = 0.15000000596
     y = 0.922999978065
     texttable = default
     textorientation = default
member =  units
     priority = 1
     x = 0.670000016689
     y = 0.922999978065
     texttable = default
     textorientation = default
member =  crdate
     priority = 1
     x = 0.75
     y = 0.922999978065
     texttable = default
     textorientation = default
member =  crtime
     priority = 1
     x = 0.850000023842
     y = 0.922999978065
     texttable = default
     textorientation = default
member =  comment1
     priority = 1
     x = 0.10000000149
     y = 0.954999983311
     texttable = default
     textorientation = default
member =  comment2
     priority = 1
     x = 0.10000000149
     y = 0.975000023842
     texttable = default
     textorientation = default
member =  comment3
     priority = 1
     x = 0.10000000149
     y = 0.995000004768
     texttable = default
     textorientation = default
member =  comment4
     priority = 1
     x = 0.10000000149
     y = 0.999000012875
     texttable = default
     textorientation = default
member =  xname
     priority = 1
     x = 0.5
     y = 0.21
     texttable = default
     textorientation = defcenter
member =  yname
     priority = 1
     x = 0.006
     y = 0.56
     texttable = default
     textorientation = defup
member =  zname
     priority = 0
     x = 0.0
     y = 0.995000004768
     texttable = default
     textorientation = default
member =  tname
     priority = 1
     x = 0.0
     y = 0.995000004768
     texttable = default
     textorientation = default
member =  xunits
     priority = 1
     x = 0.600000023842
     y = 0.277000010014
     texttable = default
     textorientation = default
member =  yunits
     priority = 1
     x = 0.019999999553
     y = 0.658999979496
     texttable = default
     textorientation = default
member =  zunits
     priority = 0
     x = 0.0
     y = 0.995000004768
     texttable = default
     textorientation = default
member =  tunits
     priority = 0
     x = 0.0
     y = 0.995000004768
     texttable = default
     textorientation = default
member =  xvalue
     priority = 1
     x = 0.800000011921
     y = 0.941999971867
     format = default
     texttable = default
     textorientation = default
member =  yvalue
     priority = 1
     x = 0.800000011921
     y = 0.922999978065
     format = default
     texttable = default
     textorientation = default
member =  zvalue
     priority = 1
     x = 0.800000011921
     y = 0.902999997139
     format = default
     texttable = default
     textorientation = default
member =  tvalue
     priority = 1
     x = 0.800000011921
     y = 0.883000016212
     format = default
     texttable = default
     textorientation = default
member =  mean
     priority = 1
     x = 0.0500000007451
     y = 0.899999976158
     format = default
     texttable = default
     textorientation = default
member =  min
     priority = 1
     x = 0.449999988079
     y = 0.899999976158
     format = default
     texttable = default
     textorientation = default
member =  max
     priority = 1
     x = 0.25
     y = 0.899999976158
     format = default
     texttable = default
     textorientation = default
member =  xtic1
     priority = 1
     y1 = 0.259999990463
     y2 = 0.24699999392
     line = default
member =  xtic2
     priority = 1
     y1 = 0.860000014305
     y2 = 0.871999979019
     line = default
member =  xmintic1
     priority = 0
     y1 = 0.259999990463
     y2 = 0.256999999285
     line = default
member =  xmintic2
     priority = 0
     y1 = 0.860000014305
     y2 = 0.860000014305
     line = default
member =  ytic1
     priority = 1
     x1 = 0.0500000007451
     x2 = 0.0399999991059
     line = default
member =  ytic2
     priority = 1
     x1 = 0.949999988079
     x2 = 0.959999978542
     line = default
member =  ymintic1
     priority = 0
     x1 = 0.0500000007451
     x2 = 0.0450000017881
     line = default
member =  ymintic2
     priority = 0
     x1 = 0.949999988079
     x2 = 0.954999983311
     line = default
member =  xlabel1
     priority = 1
     y = 0.234999999404
     texttable = default
     textorientation = defcenter
member =  xlabel2
     priority = 0
     y = 0.870000004768
     texttable = default
     textorientation = defcenter
member =  ylabel1
     priority = 1
     x = 0.0399999991059
     texttable = default
     textorientation = defright
member =  ylabel2
     priority = 0
     x = 0.959999978542
     texttable = default
     textorientation = default
member =  box1
     priority = 1
     x1 = 0.0500000007451
     y1 = 0.259999990463
     x2 = 0.949999988079
     y2 = 0.860000014305
     line = default
member =  box2
     priority = 0
     x1 = 0.0
     y1 = 0.300000011921
     x2 = 0.920000016689
     y2 = 0.879999995232
     line = default
member =  box3
     priority = 0
     x1 = 0.0
     y1 = 0.319999992847
     x2 = 0.910000026226
     y2 = 0.860000014305
     line = default
member =  box4
     priority = 0
     x1 = 0.0
     y1 = 0.0
     x2 = 0.0
     y2 = 0.0
     line = default
member =  line1
     priority = 0
     x1 = 0.0500000007451
     y1 = 0.560000002384
     x2 = 0.949999988079
     y2 = 0.560000002384
     line = default
member =  line2
     priority = 0
     x1 = 0.5
     y1 = 0.259999990463
     x2 = 0.5
     y2 = 0.860000014305
     line = default
member =  line3
     priority = 0
     x1 = 0.0
     y1 = 0.52999997139
     x2 = 0.899999976158
     y2 = 0.52999997139
     line = default
member =  line4
     priority = 0
     x1 = 0.0
     y1 = 0.990000009537
     x2 = 0.899999976158
     y2 = 0.990000009537
     line = default
member =  legend
     priority = 1
     x1 = 0.0500000007451
     y1 = 0.129999995232
     x2 = 0.949999988079
     y2 = 0.159999996424
     line = default
     texttable = default
     textorientation = defcenter
     offset = 0.01
member =  data
     priority = 1
     x1 = 0.0500000007451
     y1 = 0.259999990463
     x2 = 0.949999988079
     y2 = 0.860000014305
x/y coordinate are in % of page priority is the layer higher means on top of other objects, 0 means turn off
important eleements are dataname, title, mean, max, min, units values come from data plotted
data is the area where to plot the data legend is the area used by the legend/colorbar
see bellow for more info on text objects, but they are basically contrlled via textorientation and texttable objects properties
[50]:
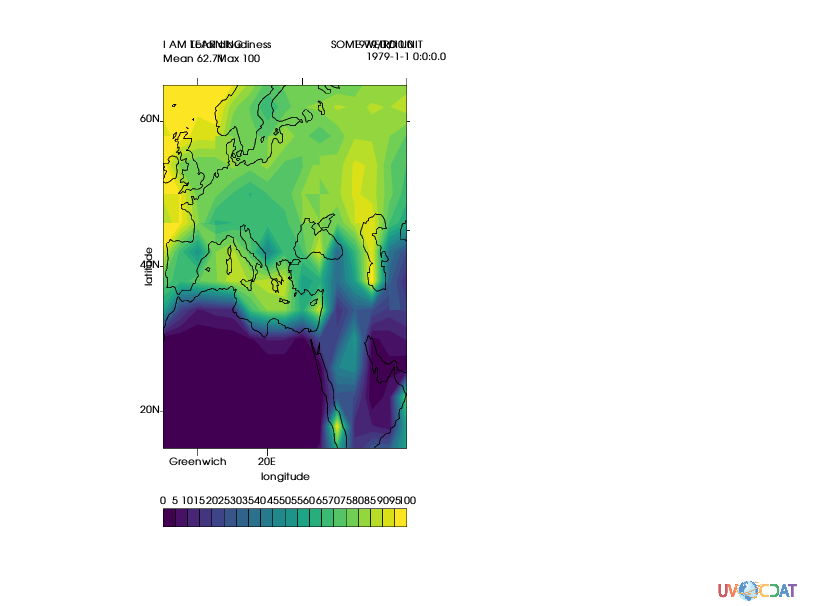
t.min.priority =0 # turn off min
s.id = "I AM LEARNING" # change dataname
s.title = "THSI IS MY TITLE"
s.units= "SOME WEIRD UNIT"

t.reset('x',.2,.5,t.data.x1,t.data.x2) # reset template to go from 20% to %0% of page (left essentially)

x.clear()
x.plot(s,gm,t)
[50]:
[51]:
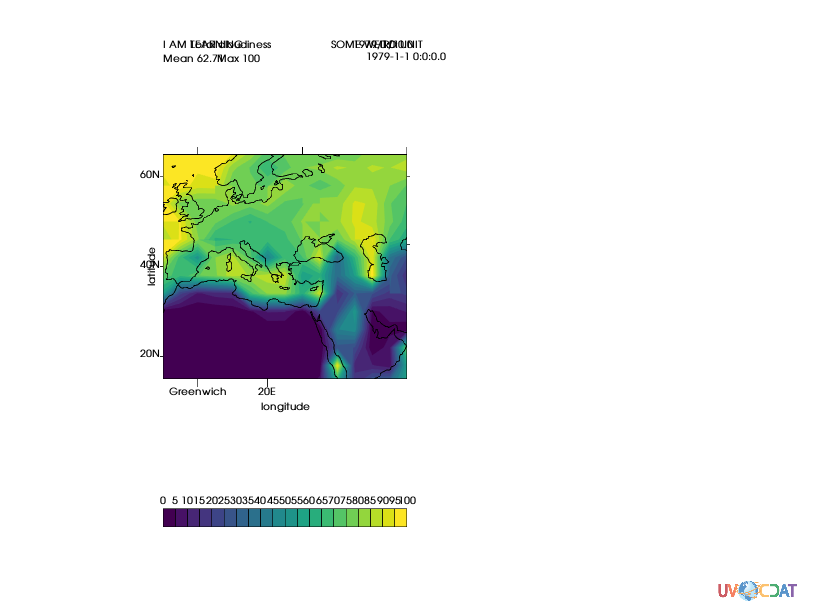
#Let's preserve the aspect ratio
x.clear()
x.plot(s,gm,t,ratio="autot")
[51]:
[ ]: