Masking Land or Sea using masks.
In this example we will show how to generate masks, including lans/sea masks
Notebook can be accessed here
Preparing the notebook
[1]:
import requests
r = requests.get("https://uvcdat.llnl.gov/cdat/sample_data/clt.nc",stream=True)
with open("clt.nc","wb") as f:
    for chunk in r.iter_content(chunk_size=1024):
        if chunk:  # filter local_filename keep-alive new chunks
            f.write(chunk)

# and load data
import cdms2
f = cdms2.open("clt.nc")
clt = f("clt", time=slice(0,1), squeeze=1) # Get first month
u = f("u", level=slice(0,1), squeeze=1)
v = f("v", level=slice(0,1), squeeze=1)
clt = clt.regrid(u.getGrid(), regridTool="regrid2") # Put data on same grid

# computes wind speed
import MV2
speed = MV2.sqrt(u**2+v**2)
print "Max speed:", speed.max()
print "Mean speed:",speed.mean()
print "Min speed:",speed.min()

# Prepare graphics
import vcs
x=vcs.init()
Max speed: 68.9132
Mean speed: 16.2591233086
Min speed: 0.0611087
Value based masks
[2]:
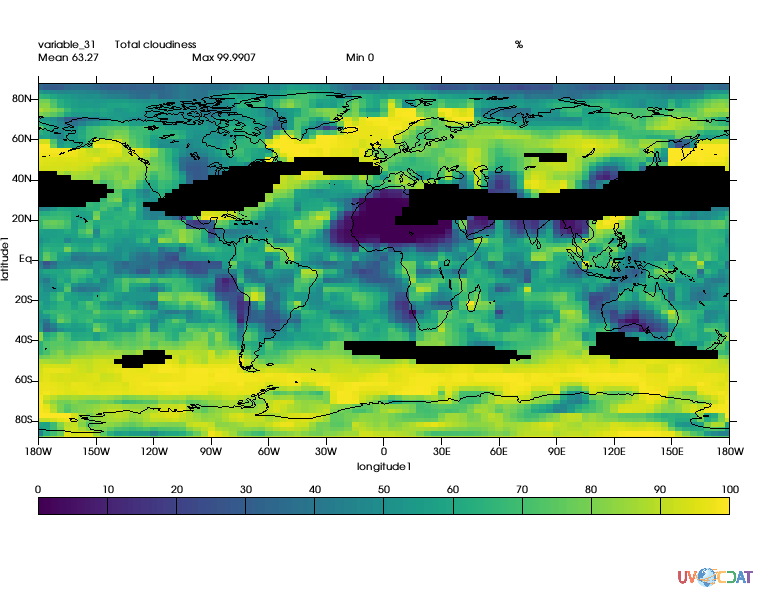
# Let's mask out area where wind speed is greater than twice mean
mask = MV2.greater(speed,speed.mean()*2.)

# Let's apply this mask
clt_masked = MV2.masked_where(mask,clt)
x.plot(clt_masked)
/Users/doutriaux1/anaconda2/envs/nightly2/lib/python2.7/site-packages/vcs/VTKPlots.py:1005: MaskedArrayFutureWarning: setting an item on a masked array which has a shared mask will not copy the mask and also change the original mask array in the future.
Check the NumPy 1.11 release notes for more information.
  data[:] = numpy.ma.masked_invalid(data, numpy.nan)
[2]:
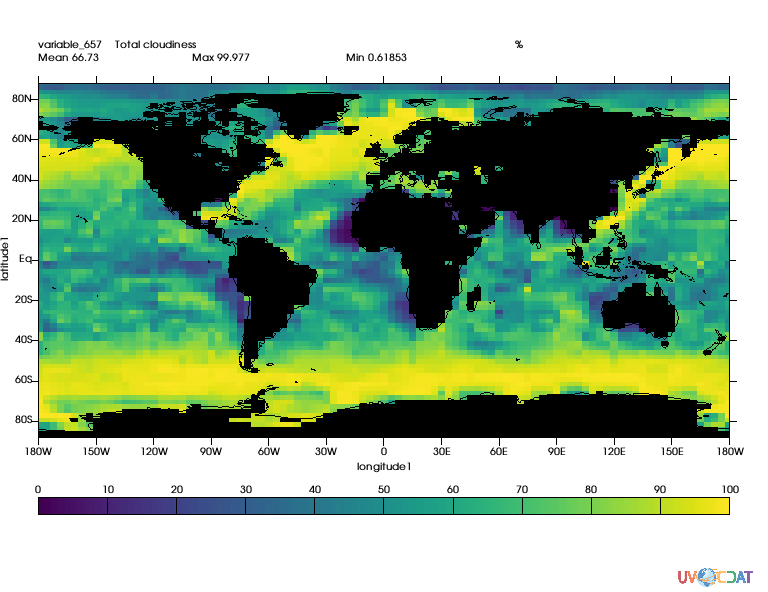
Land-sea Masks
Generating a landsea mask on any grid
Conveniently CDAT can generate masks for you (for regular grids only).
The observed data set used here as the basis for creating realistic model land/sea masks was obtained from the U.S. Navy on a 1/6 degree longitude-latitude grid.
more on the technique used can be read here
[3]:
import cdutil
mask = cdutil.generateLandSeaMask(clt)
mask2 = MV2.where(mask._mask,1.,mask) # Not needed for cdutil versions >= 2.12.2017.9.25
mask2.setAxisList(mask.getAxisList()) # Not needed for cdutil versions >= 2.12.2017.9.25
clt_masked = MV2.masked_where(mask2,clt)
x.clear()
x.plot(clt_masked)
[3]:
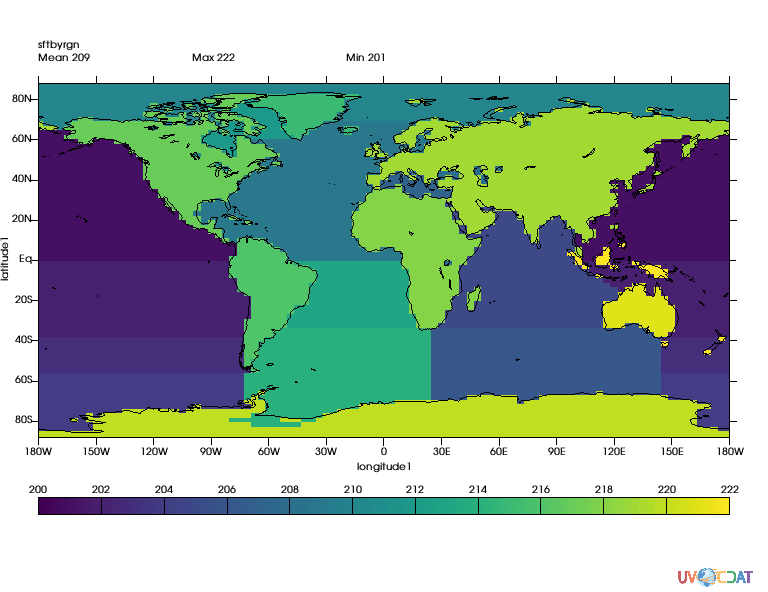
Surface type by region masks
CDAT also provide capabilities to mask regions. Original regions and their numbers come from EzGet
The function requires both a land/sea mask and a file reporting “regions”, default “region” mask is as follow:
Regions tables is:
[4]:
regions, guess = cdutil.generateSurfaceTypeByRegionMask(mask2*100., verbose=False)
Done : | | 0.00Done : ## | 4.76Done : #### | 9.52Done : ###### | 14.29Done : ######## | 19.05Done : ########## | 23.81Done : ############ | 28.57Done : ############## | 33.33Done : ################ | 38.10Done : ################## | 42.86Done : #################### | 47.62Done : ##################### | 52.38Done : ####################### | 57.14Done : ######################### | 61.90Done : ########################### | 66.67Done : ############################# | 71.43Done : ############################### | 76.19Done : ################################# | 80.95Done : ################################### | 85.71Done : ##################################### | 90.48Done : ####################################### | 95.24Done : ########################################| 100.00%
[5]:
# let's take a look
x.clear()
x.plot(regions)
[5]:
[6]:
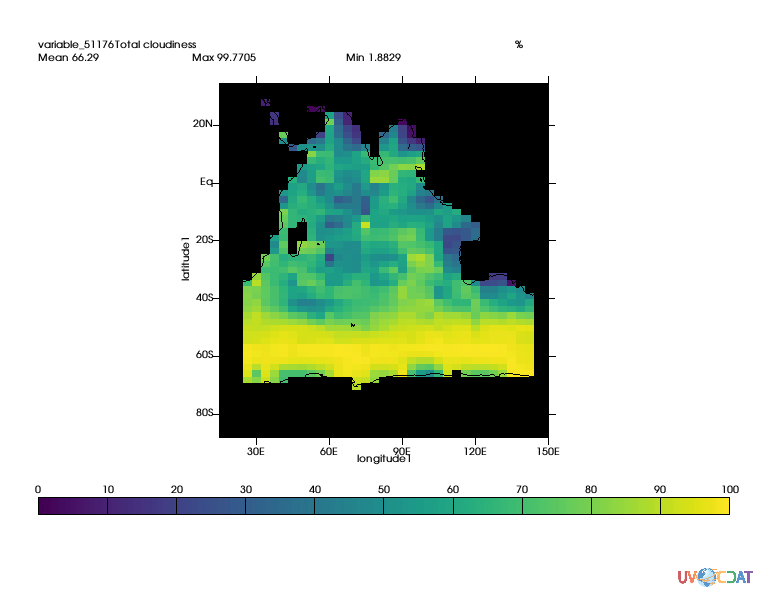
# Now let's extract the indian ocean which according to table are area 205 and 206
ind1 = MV2.equal(regions,205)
ind2 = MV2.equal(regions,206)
indian_ocean = MV2.logical_or(ind1,ind2)

clt_indian_ocean = MV2.masked_where(MV2.logical_not(indian_ocean),clt)
x.clear()
x.plot(clt_indian_ocean(longitude=(15,150),latitude=(-90,35)),ratio="autot")
[6]: