Create Your Own Colormap
Detailed reference document of the VCS colormap can be found at here.
Let’s create your own VCS colormap.
Tutorial written by Jiwoo Lee (Oct. 2017)
Colormap for example 4 provided by Karl Taylor
Contents
Import modules
[1]:
import vcs
import MV2
from matplotlib.colors import LinearSegmentedColormap
Prepare a dummy array
(back to top) - Here I prepare a dummy 2D array (240 x 2), which is being used in this tutorial only for the visualization purpose.
[2]:
a = []

num_levels = 240

for i in range(0,num_levels):
  a.append(i/float(num_levels))

for i in range(0,num_levels):
  a.append(i/float(num_levels))

a = MV2.array(a)
a = MV2.reshape(a, (-1,num_levels))

a.id = 'dummy'

v = vcs.init()
Create a colormap
(back to top) - List of VCS default colormaps can be shown using vcs.listelements('colormap')
[3]:
vcs.listelements('colormap')
[3]:
['AMIP',
 'NCAR',
 'bl_to_darkred',
 'bl_to_drkorang',
 'blends',
 'blue2darkorange',
 'blue2darkred',
 'blue2green',
 'blue2grey',
 'blue2orange',
 'blue2orange2red',
 'blue_to_grey',
 'blue_to_grn',
 'blue_to_orange',
 'blue_to_orgred',
 'brown2blue',
 'brown_to_blue',
 'categorical',
 'classic',
 'default',
 'green2magenta',
 'grn_to_magenta',
 'inferno',
 'lightblue2darkblue',
 'ltbl_to_drkbl',
 'magma',
 'plasma',
 'rainbow',
 'rainbow_no_grn',
 'rainbownogreen',
 'sequential',
 'viridis',
 'white2blue',
 'white2green',
 'white2magenta',
 'white2red',
 'white2yellow',
 'white_to_blue',
 'white_to_green',
 'white_to_magenta',
 'white_to_red',
 'white_to_yellow']
You can create your own colormap by using
`createcolormap<https://uvcdat.llnl.gov/docs/vcs/Canvas.html?highlight=createcolormap#vcs.Canvas.Canvas.createcolormap>`__Let’s make one named ‘my_cmap’. Now you will see that one is included in the list of available colormaps
Note that ‘my_cmap’ colormap is copy of the default colormap at the begining
[4]:
v.createcolormap('my_cmap')
vcs.listelements('colormap')
[4]:
['AMIP',
 'NCAR',
 'bl_to_darkred',
 'bl_to_drkorang',
 'blends',
 'blue2darkorange',
 'blue2darkred',
 'blue2green',
 'blue2grey',
 'blue2orange',
 'blue2orange2red',
 'blue_to_grey',
 'blue_to_grn',
 'blue_to_orange',
 'blue_to_orgred',
 'brown2blue',
 'brown_to_blue',
 'categorical',
 'classic',
 'default',
 'green2magenta',
 'grn_to_magenta',
 'inferno',
 'lightblue2darkblue',
 'ltbl_to_drkbl',
 'magma',
 'my_cmap',
 'plasma',
 'rainbow',
 'rainbow_no_grn',
 'rainbownogreen',
 'sequential',
 'viridis',
 'white2blue',
 'white2green',
 'white2magenta',
 'white2red',
 'white2yellow',
 'white_to_blue',
 'white_to_green',
 'white_to_magenta',
 'white_to_red',
 'white_to_yellow']
Set colormap for the canvas by using
`setcolormap<https://uvcdat.llnl.gov/docs/vcs/Canvas.html?highlight=setcolormap#vcs.Canvas.Canvas.setcolormap>`__ of VCS
[5]:
v.setcolormap('my_cmap')
Let’s make the colormap palette as pure white first
Note that ‘my_cmap’ colormap is copy of the default colormap at the beginning
[6]:
for i in range(0,240):
    v.setcolorcell(i,100,100,100)
Assign colors with index number to ‘my_cmap’ using
`setcolormap<https://uvcdat.llnl.gov/docs/vcs/Canvas.html?highlight=setcolorcell#vcs.Canvas.Canvas.setcolorcell>`__ of VCSBelow example colors are given from here
[7]:
v.setcolorcell(0,0,0,0) # black
v.setcolorcell(1,50,50,50) # gray
v.setcolorcell(2,75,75,75) # silver
v.setcolorcell(3,100,100,100) # white
v.setcolorcell(4,50,0,0) # maroon
v.setcolorcell(5,100,0,0) # red
v.setcolorcell(6,50,50,0) # olive
v.setcolorcell(7,100,100,0) # yellow
v.setcolorcell(8,0,50,0) # green
v.setcolorcell(9,0,100,0) # lime
v.setcolorcell(10,0,50,50) # teal
v.setcolorcell(11,0,100,100) # aqua
v.setcolorcell(12,0,0,50) # navy
v.setcolorcell(13,0,0,100) # blue
v.setcolorcell(14,50,0,50) # purple
v.setcolorcell(15,100,0,100) # fuchsia
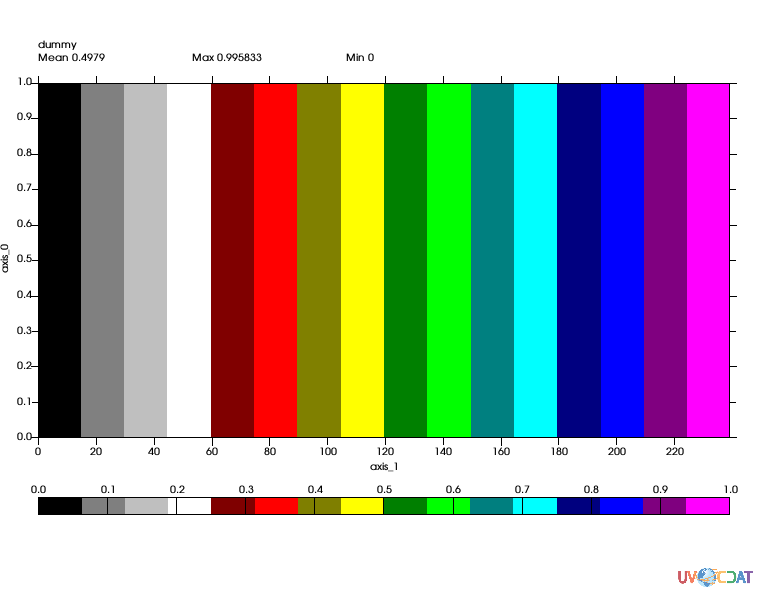
Use
box.color_1andbox.color_2ofboxfillto set starting and ending colors
[8]:
box = v.createboxfill()
box.color_1 = 0
box.color_2 = 15
box.colormap = 'my_cmap'
v.plot(a,box)
[8]:
Alternative way of creating own colormaps
Alternative way of creating your own VCS colormap uses combined capability of UV-CDAT’s VCS and Matplotlib.
Below simply written function receives name of colormap (
cmap_nameas string), and list of colors (colorsas list of strings or tuples). User can definecolorsusing either (1) named color of Matplotlib or (2) tuples of R, G, B numbers (0-1).`LinearSegmentedColormap<https://matplotlib.org/devdocs/api/_as_gen/matplotlib.colors.LinearSegmentedColormap.html>`__ of`matplotlib.colors<https://matplotlib.org/api/colors_api.html>`__, imported from the begining, stretchs given colors with smooth transition.`matplotlib2vcs<https://uvcdat.llnl.gov/docs/vcs/misc/colors.html>`__ ofvcs.colorsconvert given Matplotlib colormap to VCS colormap.
[9]:
def CreateOwnColormap(cmap_name, colors):

    # Create a Matplotlib colomap
    cm = LinearSegmentedColormap.from_list(cmap_name, colors, N=240)

    # Convert Matplotlib colormap to VCS one
    vcs_cmap = vcs.colors.matplotlib2vcs(cm, vcs_name=cmap_name)

    return vcs_cmap
Define name and colors for your own colormap
For colors, use list of either (1) named color of Matplotlib or (2) tuples of R, G, B numbers (0-1)
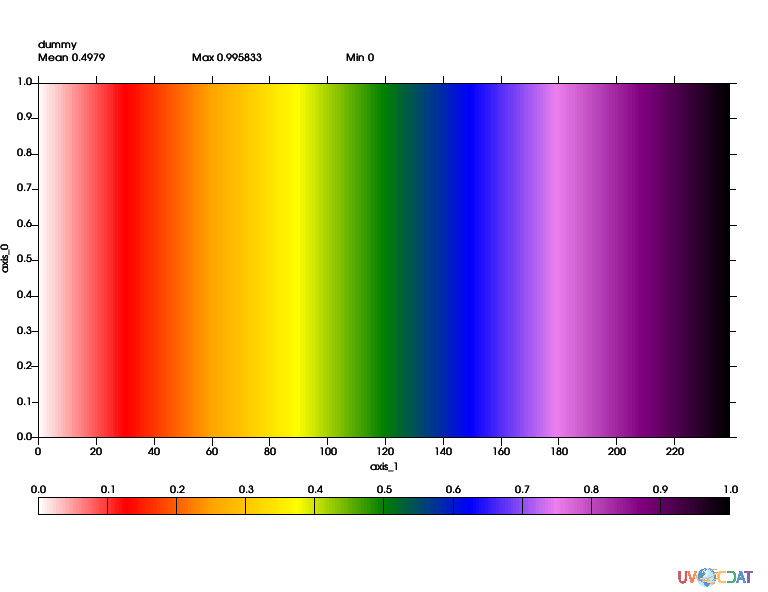
Example 1
Define colors by using named color of Matplotlib
[10]:
# Define my own colormap (name and sequentially varying colors)
cmap_name = 'cmap1'
colors = ['white','red','orange',
          'yellow','green','blue','violet',
          'purple','black']
CreateOwnColormap(cmap_name, colors)
[10]:
<vcs.colormap.Cp at 0x12183fa48>
Visualize example 1
[11]:
box = v.createboxfill()
box.color_1 = 0
box.color_2 = 239

box.colormap = 'cmap1'
v.plot(a,box)
[11]:
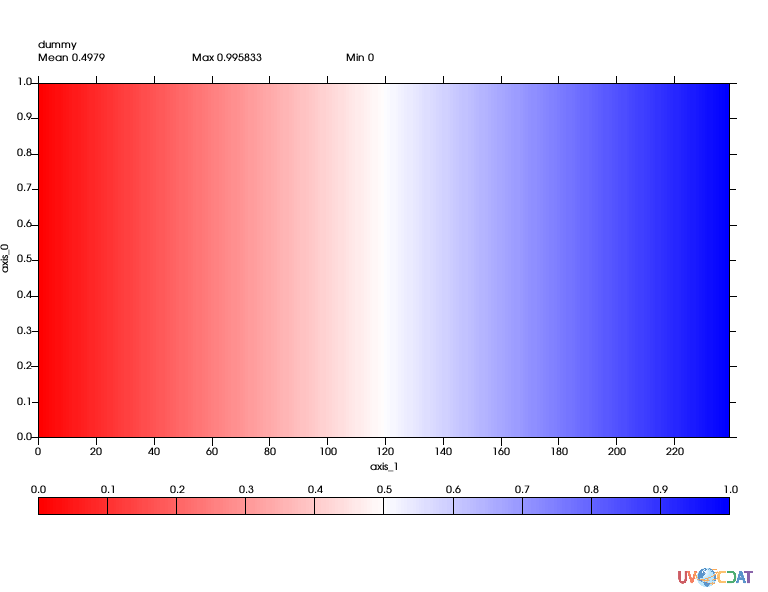
Example 2
Define colors by using list of tuples of R, G, B numbers (0-1)
[12]:
cmap_name2 = 'cmap2'
colors2 = [(1,0,0),(1,1,1),(0,0,1)] # red, white, blue
CreateOwnColormap(cmap_name2, colors2)
[12]:
<vcs.colormap.Cp at 0x11f0ea470>
Visualize example 2
[13]:
v.clear()
box.colormap = 'cmap2'
v.plot(a,box)
[13]:
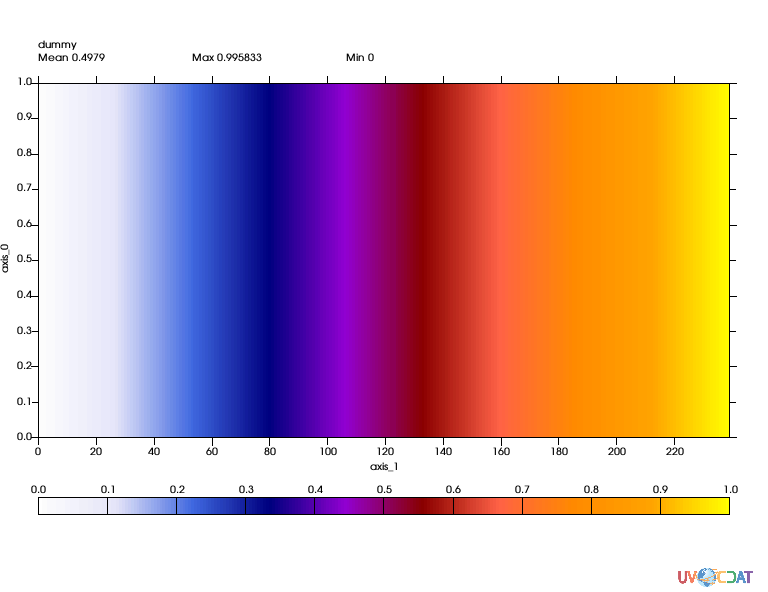
Example 3
Similar to example 1 but with more complicated set up.
[14]:
cmap_name3 = 'cmap3'
colors3 = ['white','lavender','royalblue','navy',
           'darkviolet','darkred','tomato','darkorange',
           'orange','yellow']
CreateOwnColormap(cmap_name3, colors3)
[14]:
<vcs.colormap.Cp at 0x11f0ea368>
Visualize example 3
[15]:
v.clear()
box.colormap = 'cmap3'
v.plot(a,box)
[15]:
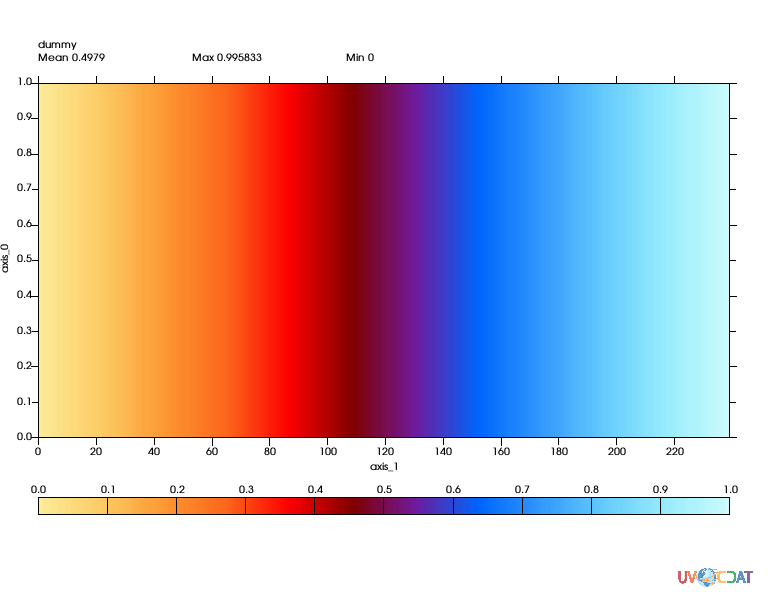
Example 4
Similar to example 2 but with more complicated set up.
[16]:
cmap_name4 = 'cmap4'

colors4 = [(99,93,60),
           (99,80,40),
           (99,60,20),
           (99,40,11),
           (99,0,0),
           (51,0,0),
           (44,11,62),
           (0,40,99),
           (20,60,99),
           (40,80,99),
           (60,93,99),
           (80,99,99),
          ]

colors4 = MV2.divide(colors4,100.) # Convert range 0-100 to 0-1

CreateOwnColormap(cmap_name4, colors4)
[16]:
<vcs.colormap.Cp at 0x11f086100>
[17]:
v.clear()
box.colormap = 'cmap4'
v.plot(a,box)
[17]: