Logo control on VCS canvas
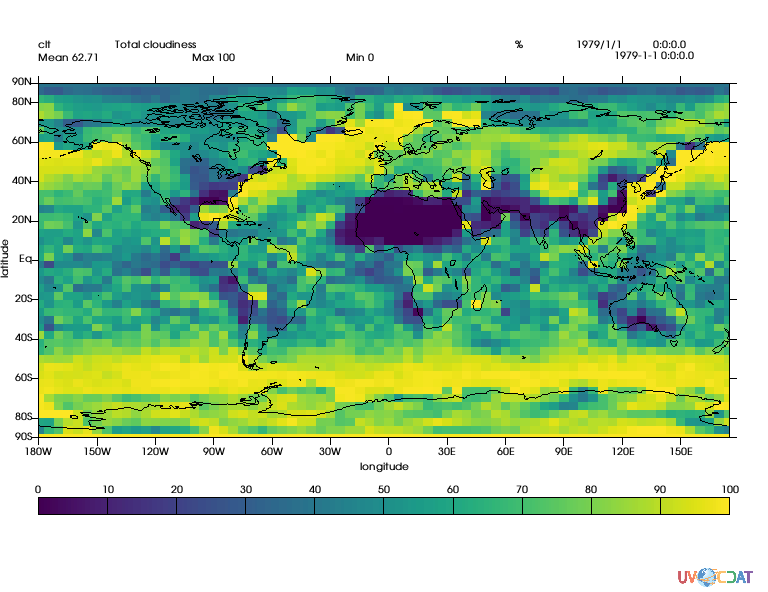
You can trun on/off showing the default UV-CDAT logo, which is originally located at bottom right.
You can add additional logo.
Tutorial written by Jiwoo Lee (Sep. 2017)
Used env: vcs-2.12, uvcdat-2.12
Contents
(top) - Prepare a sample plot - Turn OFF the default UV-CDAT logo - Turn ON the default UV-CDAT logo - Insert additional logo - Control logo location - Control logo size - Hide unwanted information above the plot
Prepare a sample plot
(top)
Let’s prepare a sample VCS plot to test logo control.
[1]:
import cdms2, vcs
f = cdms2.open('clt.nc')
d = f('clt')
x = vcs.init()
x.plot(d)
[1]:
Turn OFF the default UV-CDAT logo
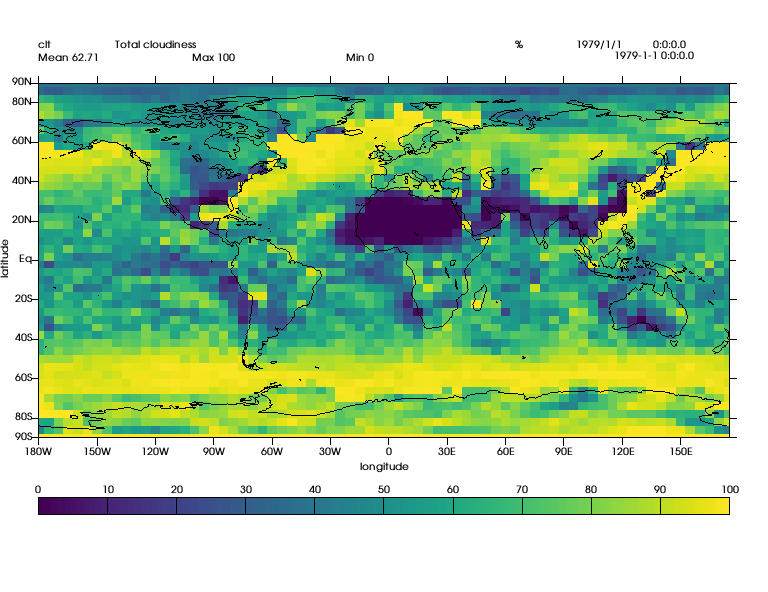
(top) - You can hide the default UV-CDAT logo, which is originally located at bottom right. - Use “drawlogooff”
[2]:
x.drawlogooff()
x.clear()
x.plot(d)
[2]:
Turn ON the default UV-CDAT logo
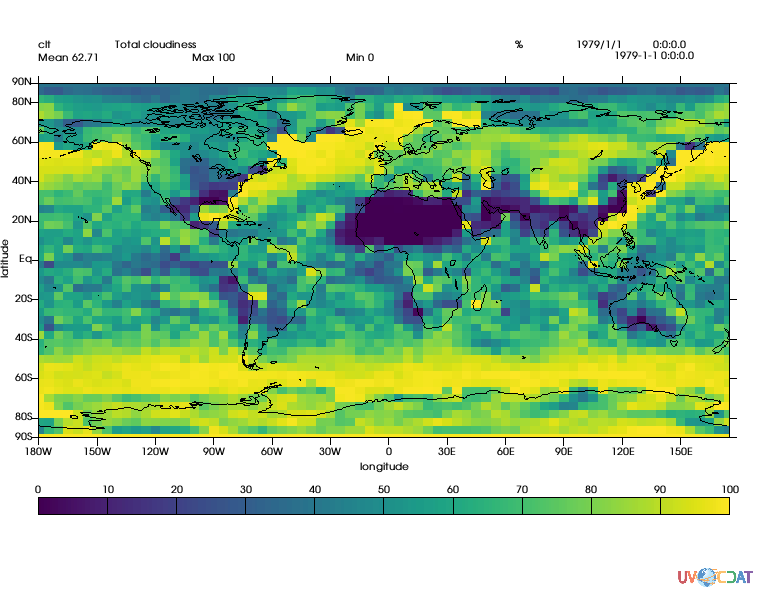
(top) - You can bring back the default UV-CDAT logo, which is originally located at bottom right. - Use “drawlogoon”
[3]:
x.drawlogoon()
x.clear()
x.plot(d)
[3]:
Insert additional logo
(top)
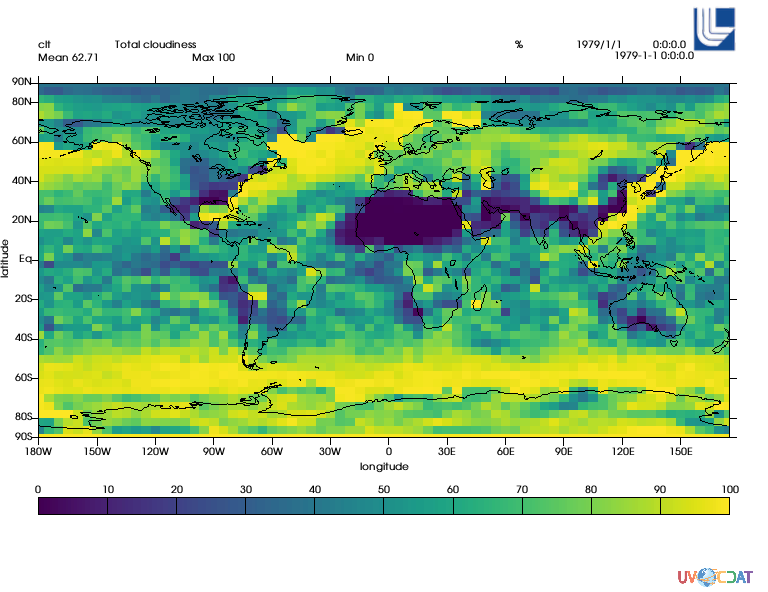
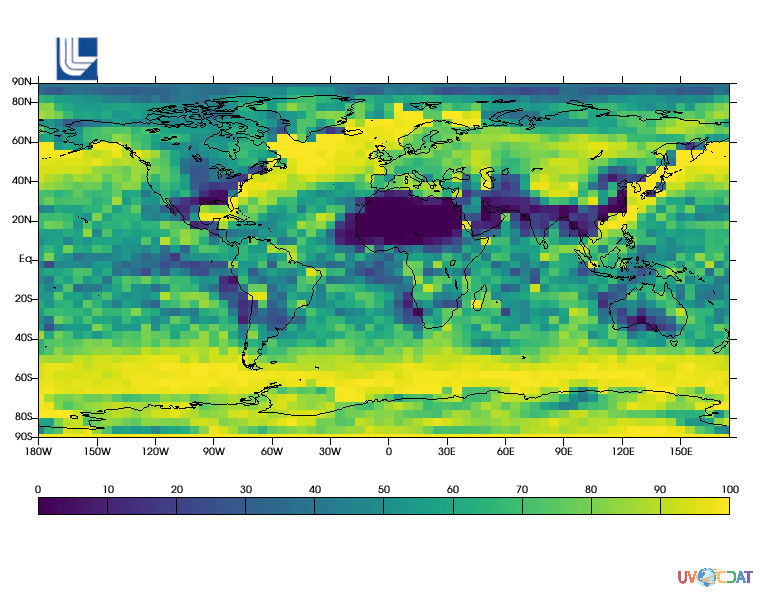
Prepare image file of logo you want to add to your directory.
“vcs.utils.Logo” allows you to have additional logo.
Default location of new logo is top right.
[4]:
x.clear()
logo2 = vcs.utils.Logo('./logo.png')
logo2.plot(x)
x.plot(d)
[4]:
Control logo location
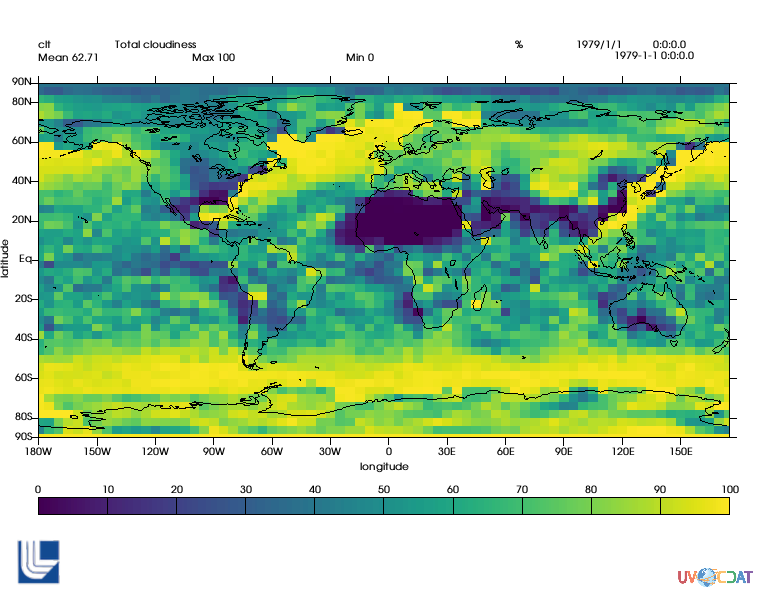
(top) - You can adjust position of the logo by using “.x” and “.y” - Given number should be in range of 0 to 1. It is ratio, relative position on canvas.
[5]:
x.clear()
logo2 = vcs.utils.Logo('./logo.png')
logo2.x = .05
logo2.y = .05
logo2.plot(x)
x.plot(d)
[5]:
Control logo size
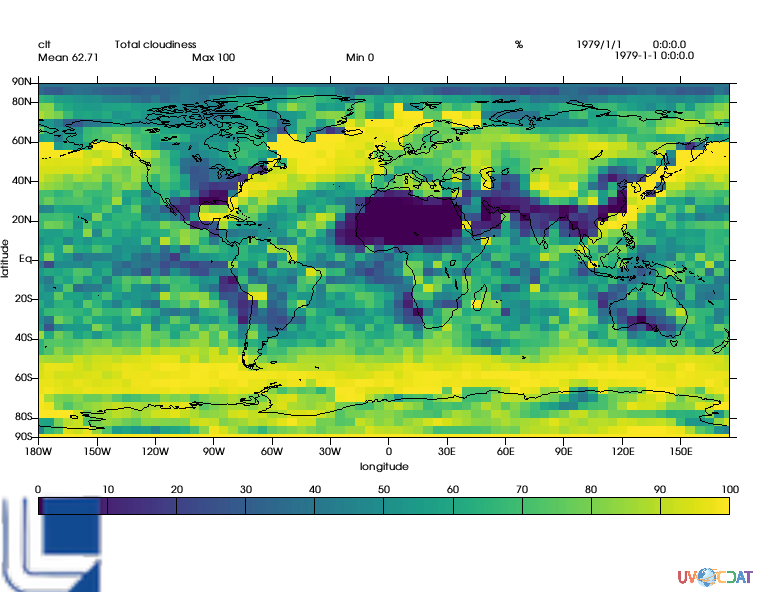
(top) - You can adjust size of the logo by using “.source_width” and “.source_height” - Below example increases logo size by 3 times.
[6]:
x.clear()
logo2 = vcs.utils.Logo('./logo.png')
logo2.x = .05
logo2.y = .05
logo2.width = logo2.source_width * 3
logo2.height = logo2.source_height * 3
logo2.plot(x)
x.plot(d)
[6]:
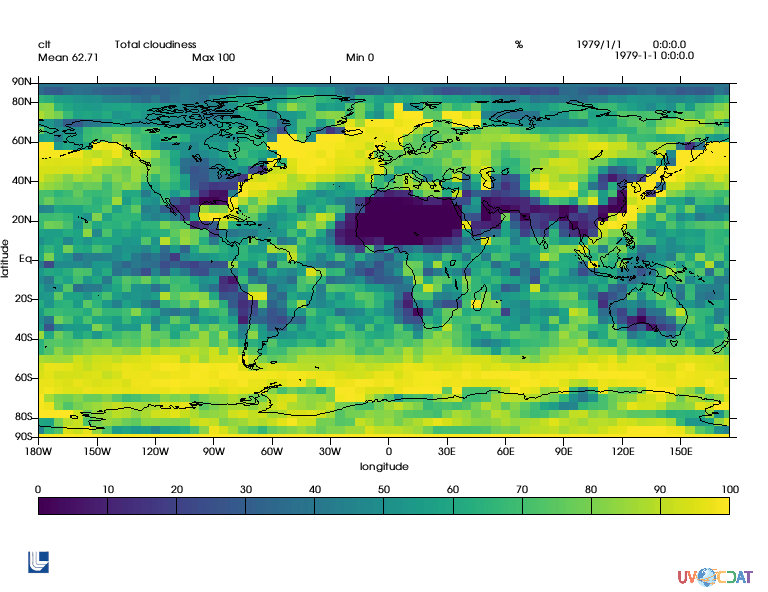
Below example reduces logo size to half.
[7]:
x.clear()
logo2 = vcs.utils.Logo('./logo.png')
logo2.x = .05
logo2.y = .05
logo2.width = logo2.source_width * .5
logo2.height = logo2.source_height * .5
logo2.plot(x)
x.plot(d)
[7]:
Hide unwanted information above the plot
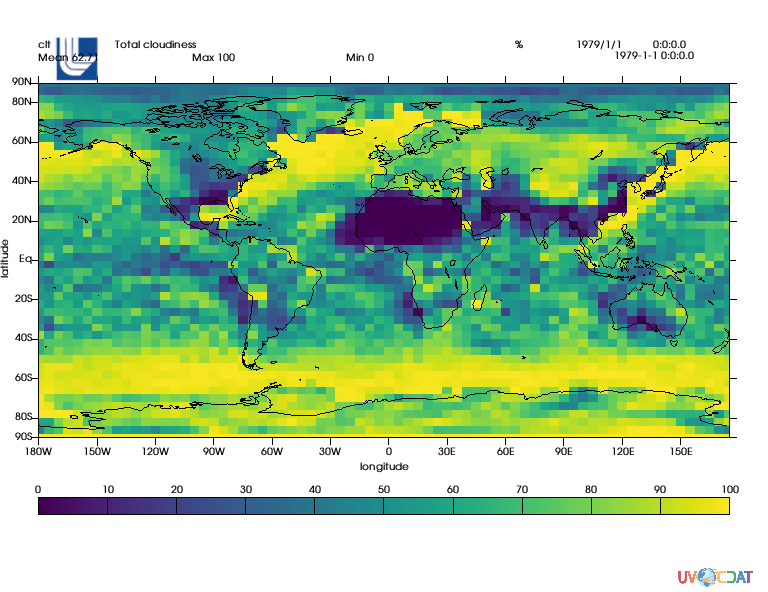
(top) - If your new logo is conflict with text information above the plot, you can hide unwanted items. - Below, some of text are overlapped with the new logo.
[8]:
x.clear()
logo2 = vcs.utils.Logo('./logo.png')
logo2.x = .1
logo2.y = .9
logo2.plot(x)
x.plot(d)
[8]:
Let’s hide those text above the plot.
[9]:
my_template = vcs.createtemplate()
# Turn off no-needed information -- prevent overlap
my_template.blank(['title','dataname','crdate','crtime','mean','min','max',
           'units','zvalue','tvalue','xunits','yunits','xname','yname'])
x.clear()
logo2.plot(x)
x.plot(d,my_template)
[9]:
To identify text you want to hide, please see below.
