Color maps of UV-CDAT
Grep all available color maps and visualize them using EzTemplate
Download Jupyter Notebook ipynb
Jiwoo Lee, LLNL, 2017. Sep.
Contents
Prepare a dummy array
(top) - We need a 2-D dummy array that will contain monotonically increasing numbers each of two rows, to be used for the visualization
[2]:
a=[]
num_levels = 224

for i in range(0,num_levels):
  a.append(i/float(num_levels))

for i in range(0,num_levels):
  a.append(i/float(num_levels))

a = MV2.array(a)
a = MV2.reshape(a, (-1,num_levels))
Colormap visualizing function
Below function will visualize given colormaps to provide a selection guidance.
[3]:
def visualize(cmlst, v, loadcmap):

    T = vcs.createtemplate()
    T.blank(['title','mean','min','max','dataname','crdate','crtime',
         'units','zvalue','tvalue','xunits','yunits','xname','yname', 'legend'])

    cmlst_num = len(cmlst)
    nrows = int(round(cmlst_num/2.))

    M = EzTemplate.Multi(template=T, rows=nrows, columns=2)
    M.margins.top = 0.05
    M.margins.bottom = 0.05
    M.margins.left = 0.2
    M.margins.right = 0.2
    M.spacing.vertical= 0.005

    for i in range(0, cmlst_num):
        box = v.createboxfill()
        box.color_1 = 16
        box.color_2 = 240
        box.xticlabels('','') # Hide x-axis tick labels
        box.yticlabels('','') # Hide y-axis tick labels
        box.colormap = loadcmap(cmlst[i])

        if i >= nrows: #right column
            jj=1
            ii=i-nrows
            x = 0.81 # text starting x position
        else: # left column
            jj=0
            ii=i
            x = 0.01 # text starting x position

        t = M.get(row=ii, column=jj, legend='none')
        t.blank(['legend'])

        v.plot(a, t, box, bg=1)

        subplot_title = vcs.createtext()
        subplot_title.string = box.colormap
        subplot_title.x = x
        subplot_title.y = (t.box1.y1 + t.box1.y2) / 2.
        subplot_title.height = 8
        subplot_title.halign = 'left'
        subplot_title.valign = 'half'
        subplot_title.color = 'black'
        v.plot(subplot_title, t)
        v.removeobject(box)
        v.removeobject(subplot_title)

        #print box.colormap  ## List available color maps
    return(v)
Open a VCS canvas
Let’s open a VCS canvas to play with!
[4]:
v = vcs.init(geometry={"width":600,"height":1200}, bg=1)
vcs.utils.defaultColorsRange = range(16,240)
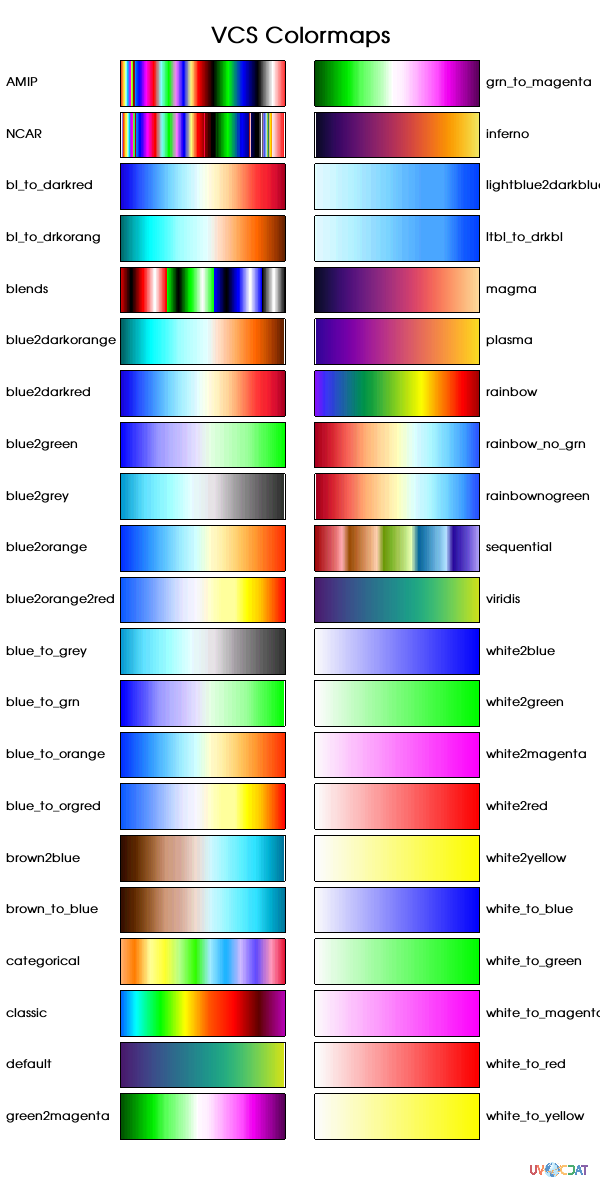
VCS colormaps
VCS is default module that is being used for the UV-CDAT. You can use VCS color maps which is loaded at the beginning.
[5]:
cmlst = v.listelements('colormap')
loadcmap = str
v = visualize(cmlst, v, loadcmap)

plot_title = v.createtext()
plot_title.string = 'VCS Colormaps'
plot_title.height = 15
plot_title.halign = 'center'
plot_title.valign = 'bottom'
plot_title.x = 0.5
plot_title.y = 0.96
v.plot(plot_title)
[5]:
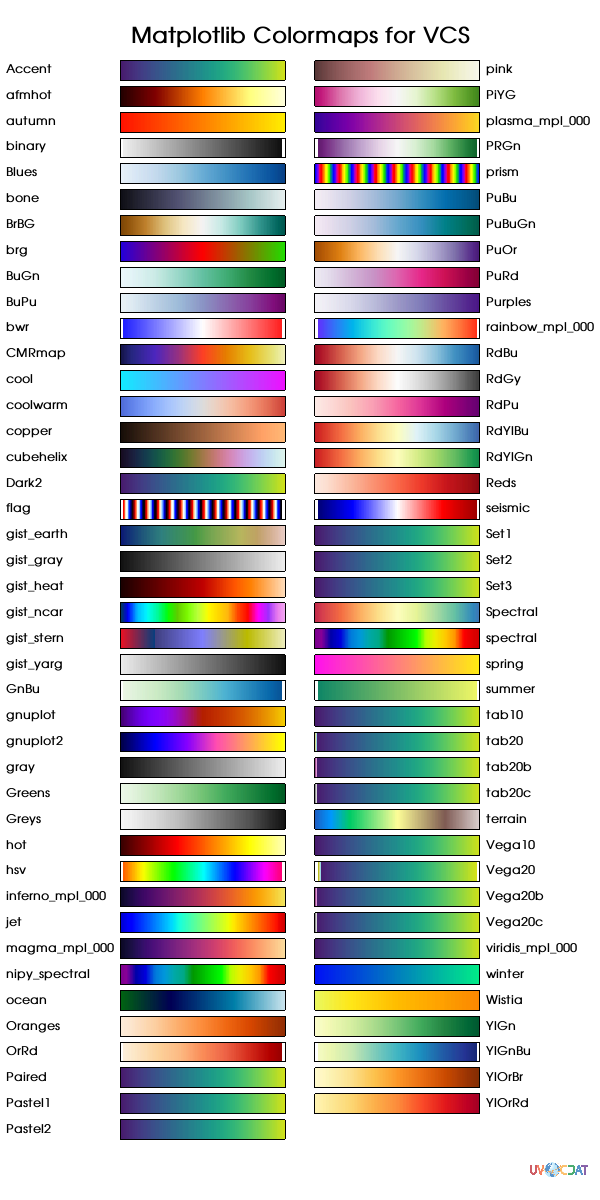
Matplotlib colormaps in VCS
You can load and visualize Matplotlib colormaps in the VCS canvas.
Use vcs.colors.matplotlib2vcs to convert
For now if same name is already being used in VCS, new name with tail
_000is assigned, as showing below as “warning messages”.You can also use
vcs.utils.loadmatplotlibcolormaps()to bring all Matplotlib colormaps to VCS
[6]:
v.clear()

import matplotlib.pyplot as plt

# Get list of all available colormaps from matplotlib (except '_r' which is reversed one)
cmlst = [x for x in plt.colormaps() if not '_r' in x]
cmlst = sorted(cmlst, key=lambda s: s.lower()) # Sort as case-insensitive alphabet order

loadcmap = vcs.colors.matplotlib2vcs
v = visualize(cmlst, v, loadcmap)

plot_title.string = 'Matplotlib Colormaps for VCS'
v.plot(plot_title)
/Users/doutriaux1/anaconda2/envs/nightly2/lib/python2.7/site-packages/vcs/colors.py:43: UserWarning: inferno colormap name was already existing, your colormap name will be: inferno_mpl_000
  (vcs_name, vcs_name_final))
/Users/doutriaux1/anaconda2/envs/nightly2/lib/python2.7/site-packages/vcs/colors.py:43: UserWarning: magma colormap name was already existing, your colormap name will be: magma_mpl_000
  (vcs_name, vcs_name_final))
/Users/doutriaux1/anaconda2/envs/nightly2/lib/python2.7/site-packages/vcs/colors.py:43: UserWarning: plasma colormap name was already existing, your colormap name will be: plasma_mpl_000
  (vcs_name, vcs_name_final))
/Users/doutriaux1/anaconda2/envs/nightly2/lib/python2.7/site-packages/vcs/colors.py:43: UserWarning: rainbow colormap name was already existing, your colormap name will be: rainbow_mpl_000
  (vcs_name, vcs_name_final))
/Users/doutriaux1/anaconda2/envs/nightly2/lib/python2.7/site-packages/matplotlib/cbook.py:136: MatplotlibDeprecationWarning: The spectral and spectral_r colormap was deprecated in version 2.0. Use nipy_spectral and nipy_spectral_r instead.
  warnings.warn(message, mplDeprecation, stacklevel=1)
/Users/doutriaux1/anaconda2/envs/nightly2/lib/python2.7/site-packages/matplotlib/cbook.py:136: MatplotlibDeprecationWarning: The Vega10 colormap was deprecated in version 2.0. Use tab10 instead.
  warnings.warn(message, mplDeprecation, stacklevel=1)
/Users/doutriaux1/anaconda2/envs/nightly2/lib/python2.7/site-packages/matplotlib/cbook.py:136: MatplotlibDeprecationWarning: The Vega20 colormap was deprecated in version 2.0. Use tab20 instead.
  warnings.warn(message, mplDeprecation, stacklevel=1)
/Users/doutriaux1/anaconda2/envs/nightly2/lib/python2.7/site-packages/matplotlib/cbook.py:136: MatplotlibDeprecationWarning: The Vega20b colormap was deprecated in version 2.0. Use tab20b instead.
  warnings.warn(message, mplDeprecation, stacklevel=1)
/Users/doutriaux1/anaconda2/envs/nightly2/lib/python2.7/site-packages/matplotlib/cbook.py:136: MatplotlibDeprecationWarning: The Vega20c colormap was deprecated in version 2.0. Use tab20c instead.
  warnings.warn(message, mplDeprecation, stacklevel=1)
/Users/doutriaux1/anaconda2/envs/nightly2/lib/python2.7/site-packages/vcs/colors.py:43: UserWarning: viridis colormap name was already existing, your colormap name will be: viridis_mpl_000
  (vcs_name, vcs_name_final))
[6]: